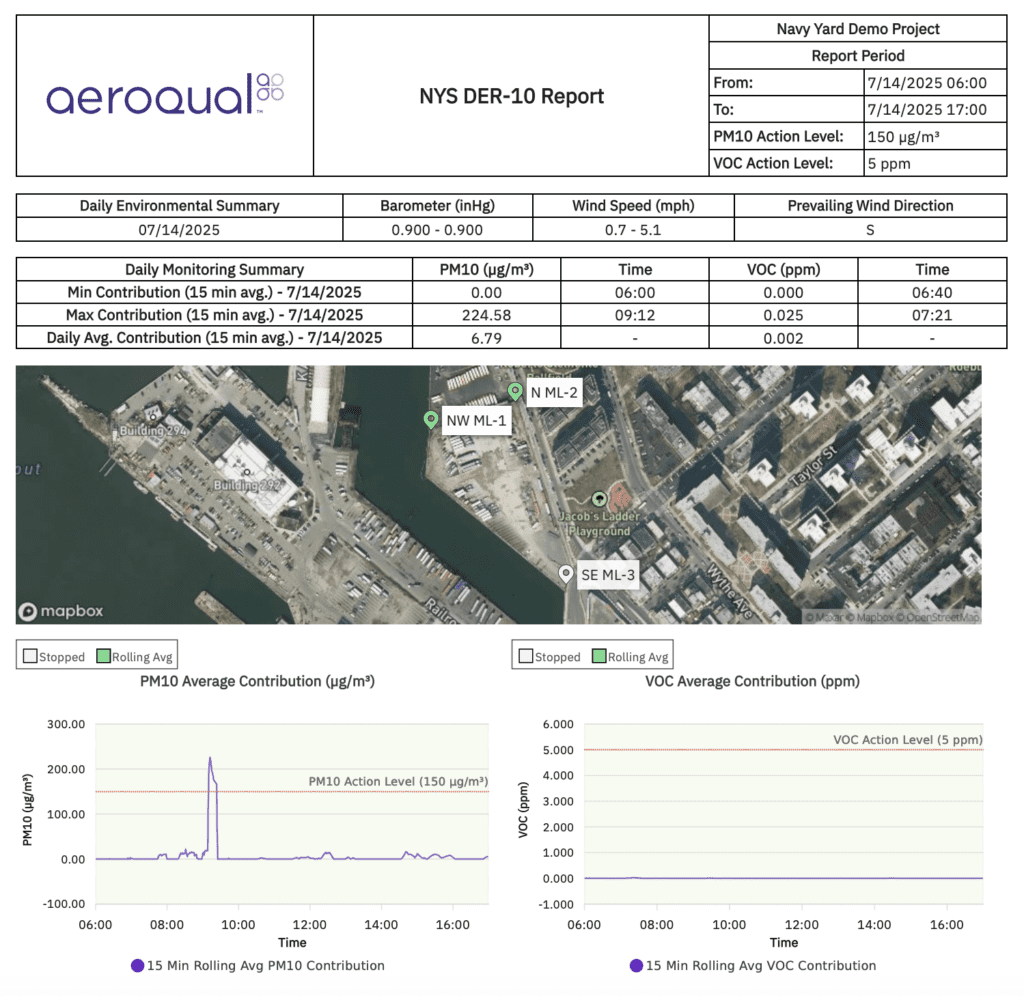
For TSCA PCB cleanup sites, you need more than raw PM10 readings. You need to understand what the site is contributing at the boundary: upwind background versus downwind PM10, evaluated as a 120-minute rolling average.
EPA’s TSCA PCB dust-control approach uses PM10 as the real-time proxy for PCB-bearing dust and points to real-time monitoring, upwind and downwind monitors, 1-minute data logging, trigger levels, and response actions to help ensure PCB-entrained dust does not leave the site.
Specto automates this for you.
Our system automatically assigns which monitors are upwind and downwind based on wind direction and monitor location, then continuously calculates site contribution in real time using 2-hour rolling averages at 1-minute intervals.
Instead of manually tracking wind shifts and recalculating the metric, your team can see what the site is contributing as work is happening.
Why Site Contribution Matters
On PCB cleanup projects, downwind PM10 alone is not enough.
Background dust levels can rise and fall throughout the day due to weather, nearby activity, and changing site conditions. What matters is whether site-generated dust is leaving the work area or crossing the property boundary.
EPA’s PCB dust-control manual is built around this challenge. PM10 is used as a practical real-time proxy because airborne PCBs cannot currently be measured with direct-reading instruments. The objective is to prevent PCB-entrained dust from leaving the site.
That is why the monitoring approach centers on:
Upwind and downwind PM10 monitoring
1-minute data logging
Rolling-average evaluation
Action-triggered response measures
Documentation that supports defensible oversight and EPA review
What EPA Expects for TSCA PCB Dust Monitoring
EPA’s 2024 TSCA PCB dust manual states that cleanup submittals should include dust control measures, real-time PM10 monitoring activities, site-specific dust action levels, oversight methods, recordkeeping, and reporting.
Once these commitments are approved in a TSCA Notification or Application, they become enforceable conditions.
The manual recommends a monitoring framework with:
A default 25 µg/m³ trigger level when PCB media concentrations are below 1,200 ppm
A more protective site-specific trigger when PCB concentrations are higher
A 120-minute rolling average for evaluating exceedances, with activities resuming once levels are back below the applicable trigger over 30 minutes
What Specto Automates
Specto turns this monitoring logic into a live operational system.
Our platform helps teams automate:
Upwind/downwind assignment based on wind direction and monitor position
Rolling-average site contribution calculations
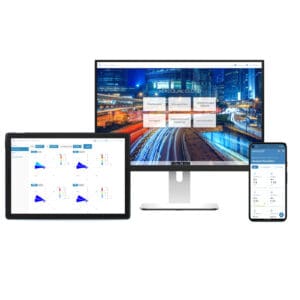
1-minute data capture with cloud visibility
Real-time exceedance alerts
Weather-integrated decision-making for site teams and regulators
Automated daily calibration
This reduces manual interpretation, enables faster response to changing conditions, and creates a clear record of site contribution over time.
Built for Defensible Field Use
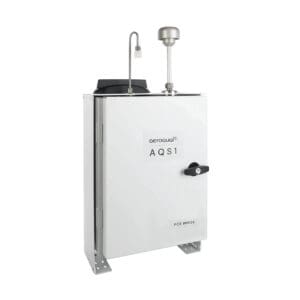
Specto systems are designed to support the type of PM10 monitoring EPA expects on TSCA PCB sites, including:
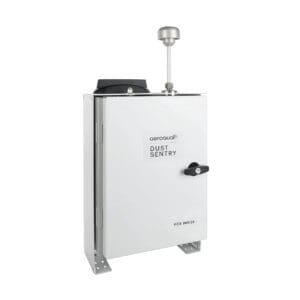
Real-time PM10 monitoring
Heated-inlet capable monitoring approaches used in stringent dust-control programs
Integrated wind speed and direction data
Automated alerts and dashboards
Documentation support for daily records and reporting workflows
For teams that need to justify monitor setup, trigger levels, and response actions to regulators or project managers, that level of confidence matters.
Where This Is Most Useful
Specto monitoring systems are well suited to PCB cleanup projects involving:
Excavation and grading
Trenching and earth-moving
Stockpiling
Truck loading, unloading, and haul routes
Pavement removal
Disturbed surface areas
Sediment and shoreline work
Landfill capping and construction-related remediation activities
Anywhere dust can be generated, the key question remains:What is the site contributing right now?
Why choose Specto Technology
Because the challenge is not just collecting PM10 data.The challenge is understanding, in real time:
What is background
What is site-generated
When trigger levels are being approached
When additional dust controls are needed
When work may need to stop
Expert technical team
Fast turnaround
Specto automates the site-contribution method so your team can respond immediately.
We begin by learning details of your projects, including timeframe, regulations, potential issues, budget and other requirements
Step 2
Development
Once we understand your needs, we develop a turnkey, solution with hardware and software, keeping both the budget and timeframe in mind.
Step 3
Implementation
We support you every step of the way, providing hands-on equipment and software training for your team to ensure that your monitoring program is successful
Request Quote
For Sales, Rentals, and Quotes, please get in touch with us by filling out the form below. Our knowledgeable staff is ready and eager to assist you!